User-Driven Data Analytics Platforms Accelerate Self-Service BI
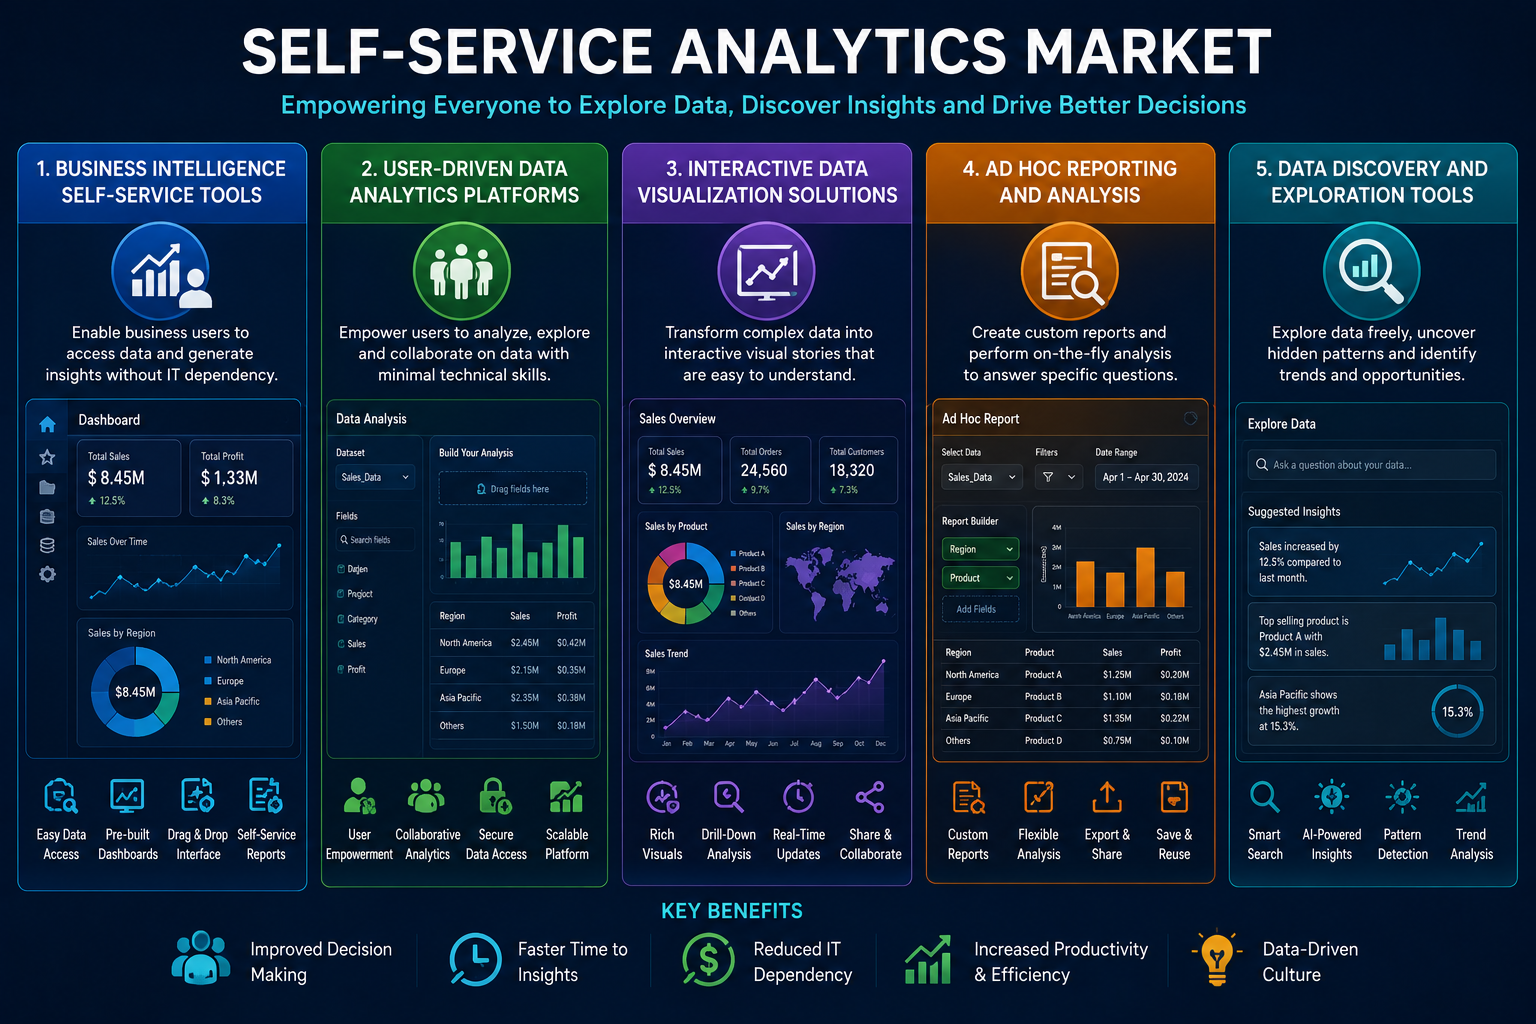
The most valuable insights often come from the people closest to the business. Sales managers know their territories. Supply chain planners know their suppliers. Customer service leads know their clients. According to a market analysis from Market Research Future (MRFR), User-Driven Data Analytics Platforms and Business Intelligence Self-Service Tools are putting analytical power directly into the hands of these domain experts. The platforms provide the infrastructure and governance; the tools provide the user interface for exploration.
The traditional model of centralized analytics creates a translation problem. The business user knows what question to ask. The data analyst knows how to query the database. The two must communicate effectively for the right report to be produced. Self-service eliminates this translation step by allowing the business user to query the data directly.
How User-Driven Analytics Platforms Enable Exploration
User-driven analytics platforms are designed for exploration rather than fixed reporting. They support iterative analysis: a user starts with a broad question, explores the data, finds interesting patterns, refines the question, and explores again. The platform supports this workflow by providing fast query performance, easy filtering and grouping, and seamless switching between chart types.
The platform also supports collaboration. Users can save their analyses, share them with colleagues, and build dashboards that combine multiple views. Comments and annotations allow users to document their findings and ask questions of other analysts.
A retail buyer might use a user-driven platform to analyze product performance. The buyer starts with a simple view: sales by category for the current month. Drilling into a category shows sales by product. Sorting reveals the top and bottom performers. The buyer applies a filter for a specific region where sales are underperforming. The analysis reveals that a popular product is out of stock in that region. The buyer initiates a transfer from a region with excess inventory.
The MRFR report notes that the exploratory workflow is fundamentally different from traditional reporting. Traditional reporting assumes the user knows what they want before they start. Exploration assumes the user will learn from the data and adjust their questions accordingly. User-driven platforms are optimized for the latter.
Business Intelligence Self-Service Tools for Accessibility
The user-driven platform provides the data infrastructure and collaboration features. Business intelligence self-service tools provide the visual interface that makes exploration accessible to non-technical users. These tools include drag-and-drop report builders, natural language query interfaces, and smart visualizations that recommend the best chart type for the data.
A hospital administrator might use a self-service tool to analyze patient readmission rates. The administrator types a natural language query: "show me 30-day readmissions by discharge unit for the last quarter." The tool translates this into a database query and displays a bar chart. The administrator then clicks on a bar representing a specific unit and says "show me these patients." The tool displays a list of individual cases for investigation.
The MRFR report highlights natural language query as a particularly important innovation for self-service adoption. Users who are uncomfortable with drag-and-drop interfaces or who think in terms of questions rather than fields can simply type what they want. The tool handles the translation to the underlying data model.
Data Preparation and Blending
One of the challenges of self-service analytics is that data is rarely ready for analysis in its raw form. User-driven analytics platforms increasingly include data preparation capabilities: column renaming, data type conversion, filtering, aggregation, and joining. These capabilities allow users to clean and combine data without moving to a separate tool.
A financial analyst might use data preparation features to combine sales data from an ERP system with commission data from a spreadsheet. The analyst uploads the spreadsheet, joins it to the ERP data on salesperson ID, creates a calculated field for commission earned, and filters out test transactions. The entire preparation workflow happens within the analytics platform, leaving a clean audit trail.
The MRFR report notes that self-service data preparation is a double-edged sword. It empowers users to work with the data they need, but it can also lead to inconsistent definitions if users prepare the same data in different ways. Organizations that adopt self-service preparation should also invest in data governance to ensure consistency.
Security and Row-Level Access
User-driven analytics platforms must enforce security policies without requiring users to understand those policies. A sales manager should see only their team's data. A regional director should see all teams in their region. A corporate executive should see all regions. The platform applies row-level security automatically based on the user's identity.
A global manufacturer might configure row-level security based on organizational hierarchy. A plant manager sees data from their plant. A division head sees data from all plants in their division. A corporate executive sees all plants. Users never need to apply filters manually; the platform adds the appropriate constraints to every query.
Conclusion
The best person to ask a question about the business is often the person who works in that business every day. User-Driven Data Analytics Platforms provide the infrastructure for exploration, collaboration, and governance. Business Intelligence Self-Service Tools provide the accessible interfaces that put exploration within reach of non-technical users. Together, they enable domain experts to answer their own questions without waiting for technical intermediaries.
Категории
Больше
Introduction to End of an Era Items End of an Era (EOAE) cards are unique, enhanced player items released to honor footballers who are retiring or leaving a club where they have left a significant legacy. These cards feature improved stats, reflecting the player's achievements and contributions throughout their career or tenure at the club. They serve as a tribute to the player's influence and...
The global market for real-time digital broadcasting is not an emerging niche; it is a colossal, multi-hundred-billion-dollar industry that has become a central pillar of the modern digital economy. A quantitative analysis of the Live Streaming Market Size reveals a market with a staggering valuation, a figure that continues to grow at an exceptionally high double-digit compound...

The Crop Insurance Market is on a trajectory of remarkable growth, with expectations that it will achieve a value of $76.11 billion by 2035, reflecting a CAGR of 10.25%. This forecast is driven by several transformative factors reshaping the agricultural insurance landscape. As farmers face increasing uncertainties due to climate change and natural disasters, the need for effective risk...

TLS Renegotiation Vulnerability Remains Unpatched A critical vulnerability in the Transport Layer Security (TLS) protocol discovered by security researchers last August continues to pose a significant threat to secure web communications. Despite being public knowledge since November, this flaw in the fundamental protocol securing online transactions worldwide remains without a comprehensive...
Struggling to decide what to stream tonight? You're not alone in the Netflix decision paralysis. Many viewers find themselves endlessly scrolling through options, wasting precious entertainment time just trying to make a choice. Enter "Netflix Roulette" - the solution for the indecisive viewer. This clever web tool randomly selects content based on your preferences. Simply input specific...